Tuesday, October 31, 2006

Tuesday, October 31, 2006

The Now:

Trick or Treat! The dollar’s getting weak!

Yesterday I said that if we saw an agreement of the US reports, whether it be positive or negative, we would see a good move for the dollar. Today both the Chicago PMI and Consumer Confidence report came in negative and as a result, the dollar took a tumble.

Chicago PMI came in at 53.5 which was much lower than the forecasted 58.0. This means that the slowdown of the US economy is trickling down to the businesses and as a result we are seeing less business activity.

The big story of the day was the weaker than expected Consumer Confidence report which came in at 105.4 compared to the forecasted 108.0. Even with lower energy prices, it seems that consumers are starting to get weary of the US economy. Remember, this report affects consumer spending and consumer spending makes up 2/3 of the US GDP (the measure of the overall economy). You can see how this weak number has put traders in a frenzy as now it seems that not only the housing market is slowing down, but consumer spending (which has been holding the economy up) might also be losing its steam. This is very bad for the dollar.

As a result of the news, my Euro trade has now been stopped out at breakeven, but we still may have another opportunity as our charts still show signs of a dollar reversal.

Because of the big negative dollar move, my Swissy trade idea has been triggered. This trade still looks good so I will continue to hold. I’ll explain more in the chart analysis below.


Coming Up:

ISM Manufacturing Index
11:00 am ET; 15:00 GMT
Previous= 52.9; Forecast= 53
With the weak Chicago PMI numbers that came out today, this report will be watched closely. If the report comes out around 50 or lower, then look for another day of dollar dropping.

Also watch out for what Mr. Bernanke has to say. He is due to speak at 2:00 pm ET, 18:00 GMT.


Chart Analysis:


EUR/USD


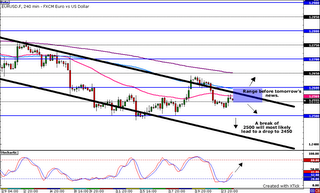
After moving down as low as 2677, the Euro has shot back up and is currently around 2762. The bearish hidden divergence is still in tact on the daily chart and we may have another opportunity to short this pair around 2800 and target 2750 and 2700.


GBP/USD


This pair also followed the technicals up until the negative US news reports came out. Now the Cable is hovering around 9100. The last time the Cable was this high was on August 8th so this is a pretty key level right now. We’ve seen the pair go around this level 4 times and each time, the price has backed down so this will be an important level to watch. Unless there is another big negative surprise in the US news reports the rest of this week, look for this pair to bounce back down again.


USD/CHF


So our trade is now active from yesterday’s post. The Swissy broke through the 61% Fib line on the daily chart after the news reports and got down as low as 2412. You can still clearly see the bullish hidden divergence so this trade still looks like it can work in our favor provided that we don’t see any drastic US news reports tomorrow.


USD/JPY


Like I stated yesterday, the Yen had been showing oversold for quite some time on the 4hr chart and made its way back up to 118.00 overnight. However, because of the news, the pair dropped back down and is now hovering around 117.00 again. In fact it got as low as 116.60 earlier today. The pair bounced off of 100 SMA on the daily chart and stochastics is currently showing oversold. However, by looking at the stochastics on both the 4hr and daily chart, I think we will see a move down to 116.50 before we see the pair reverse back up.


Conclusion:

I stated yesterday that fundamentals would ultimately decide the markets’ direction and now you see why. Even though the technicals did predict the near term movement, nothing is stronger than the power of the news! If nothing drastic happens tomorrow (i.e. ISM comes out around forecast & Bernanke doesn’t say anything too crazy), I think we’ll see some reversals from today’s movement.

Cheers,

-BP

Monday, October 30, 2006

Monday, October 30, 2006

The Now:

The dollar made up some ground after last week’s losses, but it wasn’t anything significant. Although personal spending came out lower than forecasted, personal income increased. Some economists are saying the reason that personal spending still decreased even with the increase in personal income is because of lower energy prices.

Personal spending accounts for 2/3 of the GDP which last week showed disappointing numbers.
Richmond Fed President, Jeff Lacker also said that inflation outlook is “discomforting” which means that he is still supporting a rate increase. Keep in mind that Mr. Lacker has been preaching higher rates for a while now so although he speaks very hawkishly, it will take more than just him to cause any significant gains for the dollar.


Weekly Bias-O-Meter

Right now my Bias-O-Meter still shows favor towards the dollar and if momentum shifts in it’s favor, we could see some good trades this week.

EUR/USD; GBP/USD


USD/CHF; USD/JPY


Coming Up:

Japan Interest Rate Statement
1:00 am ET; 5:00 GMT
Previous= .25%; Forecast= .25%
The consensus is that Japan will keep rates the same but look for statements that show any signs of inflation worries.

US Employment Costs
9:30 am ET; 13:30 GMT
Previous= 0.9%; Forecast= 0.9%
This is the broadest measure of labor costs. I don’t think this will move the market too much especially with the other US news coming out today.

US Consumer Confidence
11:00 am ET; 15:00 GMT
Previous= 104.5; Forecast= 108.0
With the weak personal spending report, this report will be important to gauge how consumers feel about the economy. Remember, consumer spending has been keeping the economy floating so a weak number will be bad for the dollar.

Chicago PMI
11:00 am ET; 15:00 GMT
Previous= 62.1; Forecast= 58
Once again, look for any major surprises (negative or positive) in order for there to be an effect on the dollar.


*Overall, what we want to look for is if there is an agreement with the US reports, whether it’s positive or negative. If all 3 reports line up, then we could see a nice move in all the dollar paired currencies.


Chart Analysis:


EUR/USD


Our trade has now hit our initial target of 2700. If you are still in you might want to move your stop to breakeven. 2650 looks like it will be a good 2nd target because the 50 and 100 SMA are both in that area so it should make a decent support level. Our hidden bearish divergence is now fully formed so it looks like we’ll see another drop in the Euro.


GBP/USD


We’re seeing a small regular bearish divergence on the 4hr. chart. This isn’t a strong divergence, but it does give indications that the trend is getting weak. Notice how the price made higher highs while the stochastics made lower highs. This upward trend looks exhausted and since 9050 is a long term resistance level look for this pair to drop. The question is where will it drop to? I don’t see any strong support levels so my only guess is that the pair will drop to 9000 and possibly down to 8950.


USD/CHF


On the Swissy I see a bullish hidden divergence on the daily chart. This makes sense because the Swissy is highly correlated to the EUR/USD. Notice that the pair made higher lows but on the stochastics it made lower lows. With the price currently hovering around the 61% Fib level, this gives me good indication that this pair will be headed up soon.

Trade Idea:

Buy at 2450. Stop Loss= 2400; 1st Target= 2500; 2nd target= 2550


USD/JPY


I’m still not sure about the Yen right now as the technicals aren’t really giving me much to work with. My first guess is that the pair will bounce up given the extended period of oversold indications on the Stochastics of the 4hr chart. The daily chart stochastics is also in oversold territory now so a move back up to 118.00 looks like a good possibility.


Conclusion:

Technicals are showing a short term reversal dollar rally. However, once again it will be the fundamentals that will ultimately dictate where the market is headed. Have a great trading week everyone!

Cheers,

-BP

Friday, October 27, 2006

Friday, October 27, 2006

The Now:

So I opened up my internet browser and what headline do I see flashing across my page?

“Economy weakest in three years”

If that doesn’t spell bad news for the dollar, then I don’t know what does. Basically, it was another day of the dollar getting pummeled. GDP grew at 1.6% in the third quarter which was down from 2.6% the previous quarter. This is the weakest growth pace for the US in 3 years and since the GDP is basically the main tool for measuring the economy’s strength, the weak number had a huge impact on the dollar.

With the balanced Fed statement that was given on Wednesday, traders have been looking for a catalyst to help them to decide whether not they should hold onto their dollars. These past few negative reports have been giving them ammo to shoot the dollar down. Even with the positive Consumer Confidence report, the GDP’s weaker than expected numbers already gave traders enough reason for them to make up their minds to sell the buck.

However, all is not lost. Yesterday, I mentioned that I saw a bearish hidden divergence on the EUR/USD daily. I recommended a short at 2750 with a target an initial target at 2700. Right now the trade is active and it still looks like it has a good chance of winning.


Chart Analysis:


EUR/USD


The trade recommendation from yesterday is currently active and still looks like it will head down so I would hold for now. Stochastics on the 4hr chart has been in the overbought territory for quite some time now so I think the dollar will make small rally on Monday.


GBP/USD


Just like the EUR/USD, the Cable has been showing overbought on the 4hr. chart’s stochastics. The pair may rally back up to 9050 before moving back down, or the pair could just move down from where it’s at right now which is currently around 8965.


USD/CHF


The Swissy has broken through a major support area and is now hovering around its 61% Fib level on the daily chart. Stochastics on the 4hr chart have been showing oversold for a while now so I expect a bounce to around 2530 sometime on Monday.


USD/JPY


The Yen went a little crazy today as it spiked all the way down to 117.00. For now it looks like 117.00 will be its new support but with the price being around 117.50 right now it’s hard to pick a direction. But since all the majors show signs for a short term dollar rally, my gut tells me the pair will move back up to 118.00.


Conclusion:

It’s been a tough week for the dollar with all the negative fundamentals that came out this week. Early next week should give us a slight retracement, but after that, fundamentals will once again dictate the direction of the Greenback. Have a great weekend everyone!

Cheers,

-BP

Thursday, October 26, 2006

Thursday, October 26, 2006

The Now:

The big story for today was of course….yup you guessed it--- New Home Sales. With all the attention the housing market has been getting, it’s no wonder that the New Home Sales report stole the show today.

Open up a dollar paired chart and the first thing you’ll see is the dollar getting creamed just like the Cardinals creamed the Tigers in game 3 of the World Series. Now find a news source and look at the numbers for the New Home Sales report. You’ll notice that new home sales actually surged to 5.3%, higher than what was forecasted. Now why on Earth would the dollar fall when new home sales actually went up?

Well let’s pause for a moment and think of why new home sales went up. By searching for the cause of the new home sales increase we can get the bigger picture on what’s actually going on.

New homes are a bargain! The main reason new home sales went up is because of the drop in new home prices. The oversupply of new homes is causing house prices to drop, thus people are buying these houses at a discount. When I say that house prices dropped, I don’t just mean they fell a little bit. No my friend, I’m talking about a big drop. In fact, new home prices haven’t dropped this big since 1970. September new home prices dropped 9.7% from a year ago! Talk about a bargain!

What this tells us is that the housing market is continuing to weaken, which adds to the fact that the US economy is slowing. And when the US economy is slowing, the dollar begins to fall. Voila! Mystery solved---ahem…at least for today!


Coming Up:

US GDP & US GDP Deflator (Core)
8:30 am ET; 12:30 GMT
Previous= 2.6% Forecast= 2.1%
Deflator (Core) Previous= 2.7%; Forecast=2.5%
This will be the big news event for the day. Markets will be watching these two reports very closely so be on your toes and watch for any surprises.


US Consumer Confidence
10:00 am EST; 14:00 GMT
Previous= 92.3 Forecast 92.4
This will most likely be overshadowed by the GDP report but you should still keep an eye on it.


Chart Analysis:


EUR/USD


With the weak US fundamentals today, the Euro has broken through all of its moving average resistance levels on the 4hr chart. With the strong movement, the technicals are now indicating a reversal. Notice on the daily chart that we have reached the 100 SMA. This also happens to line up with 2700 so this should make a pretty good resistance level. Stochastics on both the 4hr. and daily chart are now in overbought territory (although the daily stochastics still shows a little more room for buying power) and we can see the makings of bearish hidden divergence. As far as technicals go, I see a good probability that the Euro will move back down to around 2650 (where the 200 SMA is on the 4hr chart).

Trade Idea:

Sell at 2750; Stop Loss= 2800; 1st Target= 2700; 2nd Target=2750


GBP/USD


The Cable made a nice rally today and is currently at around 8900. Stochastics on the 4hr. and daily chart are both in and around the overbought territory so it looks like we may see a drop in the near future. I just don’t have enough technical information to come up with a specific trade.


USD/CHF


The Swissy is testing support right now on the 50% Fib level on the daily chart. It has pierced through the 200 SMA and is now resting right above the 50 SMA. Stochastics on the daily still shows a little more room for some selling power, but a reversal could be coming shortly.


USD/JPY


Well 119.00 was broken through and now it looks like there’s a good chance the Yen will hit 118.00. I’m not sure how far the Yen will fall before moving back up because Stochastics on the daily chart still shows a good amount of room before becoming oversold. 118.00 should be a good support level because it’s also where the 200 SMA is.

Wednesday, October 25, 2006

Wednesday, October 25, 2006

The Now:

So the Fed kept interest rates unchanged which was pretty much expected. However, their tone was relatively flat. It seems like most traders were expecting them to sound a little more hawkish but instead, the Fed was pretty moderate in their statements. Basically they still mentioned their inflation worries but they said it with a cool and calm voice.

“Inflation pressures seem likely to moderate over time.”

“Going forward, the economy seems likely to expand at a moderate pace.''

“Some inflation risks remain.”

So the vibe that people are getting is that the Fed is going to keep rates unchanged. What is getting under everyones skin however is that the Fed isn’t really giving any strong clues as to what they are going to do after this pause.

Existing Home Sales fell to 6.18M which was lower than the forecasted 6.25M. This just adds confirmation that the housing market is really cooling off. The median house prices fell from $225,000 to $220,000 in September. This was stated as the biggest year-over-year drop since 1968. While month-over-month declines aren’t uncommon, year-over-year drops are more serious. The housing market has been a big factor for the slowing economy and today’s report just adds confirmation that the economy will still continue to be sluggish.

On the other side of things, the German IFO index came in at 105.3 which is higher than the previous number at 104.9. This provided support for the Euro and is the cause for some of that Euro rally we saw today. I realized I made a mistake in my post yesterday because I said if the number was lower than 103 it would cause a Euro rally. I meant to say that it would cause a dollar rally. It doesn’t matter now anyways since the number came out higher than the forecast but I just wanted to clarify so that no one gets confused.


Coming Up:

US Durable Goods Orders
8:30 am ET; 12:30 GMT
Previous= -0.5%; Forecast= 2.0%
With the balanced Fed statement today, pay close attention for any surprises because traders will be looking for some sort of direction.

US Jobless Claims
8:30 am ET; 12:30 GMT
Previous= 199k; Forecast= 305k
I don’t think this will have much effect on the market unless there is a huge surprise.

US New Home Sales
10:00 am EST; 14:00 GMT
Previous= 4.1% Forecast -0.1%
I think this will be the most closely watched report because of all the press the housing market is getting. Once again, look for any surprises because it would put the market in a frenzy.


Chart Analysis:


EUR/USD


All technical indicators are showing signs for a short term dollar rally. Currently the Euro is right around 2600 with stochastics showing overbought on the 4hr. chart. An aggressive play would be to short now and target 2550 with a stop at around 2650. However, a good conservative play would be to short at 2650 because that is where the 200 SMA is on the 4hr chart is as well as the 50 SMA on the daily chart. What this means is that this is a good resistance point so if price gets up that high, we’ll probably see a drop in the Euro. Daily stochastics is still headed up and is not overbought yet so this trade looks like it could happen. However it’s still not 100% certain that the price will get that high before dropping because the 4hr stochastics is already showing overbought and looks to be heading down now. Either way, the conservative play looks to be the safest option if the trade actually triggers.


GBP/USD


The Cable is looking pretty bland as there really hasn’t been a clear direction the past few days. Only trade idea I see is to short at 8800 and target somewhere between 8730-8740. The reason is that stochastics is showing overbought on the 4hr. chart and 00 levels always make for a good support/resistance level. The reason I target 8730-8740 is because that is where the 50 SMA on the 4hr. chart will probably be if this trade triggers.


USD/CHF


I really don’t have a clue where this pair is going right now. The Swissy is currently at 2649 and my gut is saying that in the short term the pair will reach 2700 because the 100 SMA on the 4hr. chart is at 2631 which makes for an ok support area and stochastics on the 4hr. chart is showing oversold. However on the daily chart, stochastics looks like it is moving down and there are no support or resistance levels nearby. I’m not 100% confident in this pair as of now but a short term rally to 2700 seems like the most probable scenario.


USD/JPY


I said yesterday that 119.00 would provide good support and so far it has been holding up. Now that stochastics on the 4hr. chart is showing oversold, a long trade seems like the best bet. A low risk trade would be to go long now and target 119.50 with a stop at 118.80 (which is right below the 100 SMA). On the flip side, if price moves below 118.80, look for a drop to around 118.20 which is where the 200 SMA is on the 4hr chart. Stochastics on the daily chart looks like it could be headed down so this short trade might be another possibility.


Conclusion:

With the balanced statement from the Fed, it seems like traders are once again playing a guessing game with the dollar. Look for any extreme surprises on any US economic reports coming out soon because they will probably cause any dollar related pair to move quite nicely.

Happy trading everyone!

-BP

Tuesday, October 24, 2006

Tuesday, October 24, 2006

The Now:

The markets moved in accordance with the technicals today since there were no major economic catalaysts. The best movement was in the Swissy where I said yesterday in the chart analysis that there was a nice hidden divergence. Like magic, after hitting 2700, the Swissy dropped back down to as low as 2641. Now would be a good time to lock in some profit since it has bounced off its 50 SMA on the 4hr. chart.

There isn’t much to talk about since the real action probably won’t begin until tomorrow. However, I did read something pretty interesting that I’d like to share:

“One of the key reasons for Fed’s recent hawkishness has been record level of Dow Jones Industrial Average which reached a high of 12,116 yesterday. Typically the Fed will not loosen monetary policy until US equity markets begin to show weakness. Yet the rise in US stock market has been driven more by prospects of a benign interest rate environment rather than underlying fundamental growth. (Note the latest warning from CAT and Ford’s massive Q3 losses.) Therefore, any strong indication by the Fed that it may resume rate hikes is likely to trigger a sell off in equities which ironically enough may force the Fed to ease off. Thus trapped between a rock and hard place we doubt the US monetary officials will do anything but remain still for the time being. “

Read the full article:


Coming Up:

Germany IFO Index
4:00 am ET; 8:00 GMT
Previous= 104.9; Forecast= 104.5
I don’t think this will be a big mover but any number lower than 103 could cause a short term Euro rally.

US Existing Home Sales
10:00 am ET; 14:00 GMT
Previous= 6.30M; Forecast= 6.25M
This report will be watched closely since real estate has been declining lately. A strong number (7.5-8.0M) should cause the dollar to soar. A weak number like 5M will most likely cause a dollar sell off, especially if the Germany IFO Index was strong.

US Interest Rate Statement

2:15 pm EST; 18:15 GMT
Previous= 5.25%; Forecast 5.25%
The overwhelming consensus is that the Fed is going to keep interest rates the same so if for some reason the Fed changes rates, expect a huge move in the dollar. The statement will also be watched closely for inflation and the pace of growth for the US economy.


Chart Analysis:

With the interest rate statement coming out tomorrow, I’m not too sure how well these prices will follow the technical indicators. Be cautious when trading tomorrow


EUR/USD


The Euro is right around 2550 and technically this pair looks like it will get to 2600 sometime tomorrow. Remember, 2500 is a key support so a break of that level will probably cause a move to at least 2450. If US fundamentals are strong tomorrow we might see a spike below 2500.


GBP/USD


I said yesterday that the technicals showed signs for a Cable rally today, and that’s exactly what happened. My safe target was the 200 SMA on the 4 hr. chart and that’s about as far as the Cable got. If you took that trade, it’s probably best to exit now. 8700-8760 will most likely be the range until the news comes out tomorrow.


USD/CHF


The hidden divergence once again proved to be an exceptional trading tool as my trade followed my analysis perfectly. Yesterday I said to short at 2700 and target 2600. Well even though the Swissy didn’t get down that low it got as low as 2641. If you are in this trade it’s best to lock in some profit, close your trade, or move your stop to breakeven as the price is now resting on the support of the 50 SMA on the 4hr. chart.


USD/JPY


The Yen looks like it will have good support at 119.00 since it’s a 00 level and it’s also where the 50 SMA on the 4hr chart is lining up at. Stochastics on the 4hr shows that the Yen will probably continue to drop for a little while longer. The news will once again be the deciding factor on where this pair goes tomorrow. Technically I can’t really find a clear direction.


Conclusion:

The dollar lost some of its gains today but tomorrow’s news should cause some big movements. Be very careful if you trade tomorrow as we’ll probably be seeing plenty of spikes. I should have a clearer technical picture after the interest rate statement.

Happy trading everyone!

-BP

Monday, October 23, 2006

Monday, October 23, 2006

The Now:

Well Friday was a pretty dull day in the markets since there were no major economic reports out. However, my chart analysis did follow through after today’s action because of the speculation that the Fed will raise rates, not cut them, sooner rather than later.

The big “I” word, inflation, has been the topic of discussion lately and it seems the Fed, along with a bunch of economists are still worried about it. In other words, while many traders were expecting the rates to decrease after this pause, the focus has shifted to the possibility that the Fed will actually raise rates due to inflationary worries.

So what does this mean for the dollar? Simple—Open up your charts for today and notice the dollar rally that occurred. Higher rates= dollar strength. The rates will hold steady for now, but what traders are trying to find out is the Fed’s next step. If it appears that inflation is high and rates need to increase, then so will the dollar.


Weekly Bias:

My bias is still the same as the past 2 weeks even though the dollar lost some ground last week. One thing I am noticing though is that the dollar rally is getting very weak. In fact on some of my other pairs that I watch, my Bias-O-Meter is giving me a dollar negative bias for the week. This leads me to believe that we might start seeing dollar negative weeks soon unless economic factors (US reports, Fed, etc.) can provide enough support for the dollar.

GBP/USD; EUR/USD


USD/CHF; USD/JPY


Coming Up:

Big Pippin’s Dentist Appointment
8:30 am ET; 12:30 GMT
Previous= $$$; Forecast= $$$$$$
I have to go in to my dentist dude and get some new grills for my choppers. I’m going platinum this time because gold is out. The previous number was $bling, and the forecast for tomorrow’s appointment is $ a lot more bling. Afterwards I might swing by my auto shop and get some new rims for my ride.

Seriously, there’s not really any note-worthy news reports coming out. I think trading will be dead tomorrow as traders will most likely be waiting for the interest rate statement on Wednesday.


Chart Analysis:

EUR/USD


After today’s dollar rally, I see 2 possibilities. The price is currently at 2550. On the 4 hr. chart stochastics is showing oversold conditions and the daily chart stochastics is heading up and is not showing overbought yet. This pair could bounce off of 2550 and head back up to 2600 or we might see it test that strong support at 2500 before bouncing back up. Unless of course the Fed makes some crazy statement that they will definitely raise rates which would probably put the market in a frenzy and push the dollar below 2500. But that’s just my imagination running wild again.


GBP/USD


After breaking through it’s 200 SMA on the 4hr. chart, the Cable has moved back down and is once again testing support at around 8700 which is where both the 50 and 100 SMA on the 4hr. chart are. Stochastics on both the 4hr. and daily chart show that the Pound will make a rally and I think the safest target is around 8770, which is where the 200 SMA is currently at on the 4hr. chart. The more aggressive target would be at 8800.


USD/CHF


Ahhh a good ol’ hidden divergence on the 4hr chart. Notice that as the Swissy made lower highs, the stochastics made higher highs. This is a good technical indication that the price will move back down. My dilemma here is that on the daily chart, today’s candle formed a huge green blob. Usually whenever I see a huge green or red candle, it’s usually followed by a continuation of that trend. So you can see that I’m torn right now. The safest and least risky play on this pair would be to short the pair at 2700 with a stop at 2750 and a target at 2600.


USD/JPY


I have no clue what the Yen is going to do right now. The one thing I do know is that between the 50 and 00 levels, the price is drawn to them like magnets. Right now the pair is hanging around 119.29. The only safe trade idea that I see is if the price breaks 119.50. You could go long somewhere around 119.60 and target 120.00. Just keep a tight stop since your potential profit is only 40 pips.


Conclusion:

Fundamentally, the dollar looks poised for another rally now that inflation has everyone shakin in their pants. Wednesday is the big interest rate statement and it’s most likely that rates will be held the same. On that same day, Existing Home Sales comes out so that could cause a dollar sell off if the real estate woes continue. Overall, it should be an exciting week so be ready!

Happy trading everyone!

-BP

Thursday, October 19, 2006

Thursday, October 19, 2006

The Now:

It’s funny how when I say that it’s unlikely we’ll see a big move in the Forex, it just seems to soar like a rocket! I should’ve known that the Philly Fed Index was going to put the market in a frenzy again. Last month the index came in at -0.4 which was a big negative surprise and it caused the dollar to tumble. Well with the forecast for this months report at 7 and the release of the actual number at -0.7, the market pulled a de ja vu and sold off the dollar.

Not only did the index come at a much lower number than expected, it actually decreased from last month’s number. But really, this report is only solidifying what I’ve been saying for a while now. The US economy is not growing at its fast pace anymore. It’s still growing in certain areas such as consumer spending and at the same time it’s declining in other areas, such as the real estate market. And I don’t know how many times traders need to be reminded that the Fed is not going to increase rates NOR will they decrease them. For the next few months, the interest rates will hold steady.

The Leading Indicators Index came in at 0.1%. Although that was slightly lower than the forecasted 0.3% it still was an increase from the previous month which was set at -0.2%. What this is telling me is that the US economy is growing—but at a slow pace and that it will probably continue to move at this pace for the next few months. I still expect consumer spending to rise, especially with the holidays coming up so I think the dollar will still be able to hold some ground against the majors.

For the Alba lovers, there was an Alba breakout today at 9:40 am ET. Entry was at the close of the candle at 2588. The stop was at 2562 and the target was at 2604. The target was hit at 10:40 and I closed 2 lots and moved the last lot’s stop to the low of that candle which is where I eventually got stopped out at 2597.

Result: +32 +9 -9(spread)= +32 pips


Coming Up:

UK GDP
4:30 am ET; 8:30 GMT
Forecast= 0.6%; Previous= 0.7%
A growing GDP will help support the idea that the BOE will raise rates in November. A strong number should continue the Cable’s rally against the dollar.


Chart Analysis:

EUR/USD


Yesterday I said that a break of 2560 would lead to a move to 2600. Today’s poor Philly Fed Index report made that prediction come true. So now the Euro is past 2600 and has pierced through its upper trend channel line. 2670 is the next resistance level because it is where the 50 SMA is on the daily chart and also where the 100 SMA is on the 4hr chart. Stochastics on the 4hr chart is showing overbought right now but on the daily chart it is sloping upwards and still in middle ground. This leads me to believe that we’ll see a short term retracement, followed by another Euro rally to around 2670.


GBP/USD


The Cable made a nice rally today. Right now it’s testing resistance at around 8780. I think it will make another short term rally to 8800 overnight, but will fall back down to 8750. Stochastics is almost showing overbought on the 4hr. chart and with the 200 SMA at around 8780, the technicals are indicating another short term dollar rally.


USD/CHF


The Swissy made a huge gain against the dollar. Right now the pair is at a good support level. On the daily chart it is hovering right around its 38% retracement level as well as the 200 SMA. However, stochastics is still heading down and is not in oversold territory yet. I see 2 possibilities. The pair can continue its downtrend and if it breaks 2500, I can see it getting to at least 2470 and maybe even 2450. Or the pair can bounce off of support and rally to 2650.


USD/JPY


All signs on the Yen are showing that a dollar retracement is going to happen soon. Right now the pair has bounced off of 118.00. On the daily chart, notice how the lower trend channel line matches the 50 SMA, I think this will provide good support. On the 4hr. chart, the 200 SMA is hovering right around 117.80.

Trade Idea:

Aggressive: Buy at 117.80; Stop Loss= 117.20; Target= 118.50

OR

Conservative: Buy at 117.50; Stop Loss= 117.20; 1st Target= 118.00, 2nd Target= 118.50


Conclusion:

The dollar took a beating today. I’d like to say that dollar will make a strong rebound tomorrow but there aren’t any US reports that can give it some juice to move. But then again, I said this yesterday and look what happened, so just remember that anything’s possible.

Happy trading everyone!

-BP

Wednesday, October 18, 2006

Wednesday, October 18, 2006

The Now:

The story for today was the Housing Starts report. Yesterday I talked about how the market showed signs of a short term dollar rally. Given the surprising increase in Housing Starts, the dollar was given some fundamental juice to spark some gains across the 4 majors.

The previous Housing Starts number was $1.67M. I noted yesterday that if today’s report came in at a higher number, we would see the dollar rally. Given that the forecast was at $1.64M and the actual number was $1.77M, the market reacted and pulled the dollar higher.

The CPI came in lower than expected at -0.5%. This shows the effect of the falling oil prices. Core CPI which excludes Food and Energy came in right at its forecast at 0.2%.

The BOE minutes sounded very hawkish. With all the positive UK data that has been coming out lately, I think there is a good chance we will see a rate hike in November.


Coming Up:

UK Retail Sales
4:30 am ET; 8:30 GMT
Forecast= 0.3%; Previous= 0.3%
A higher number than 0.3% should cause a short term rally for the Cable. It’s looking more like the BOE will raise rates in November so a good number would provide support for the Pound.

Jobless Claims
8:30 am ET; 12:30 GMT
Forecast= 310,000; Previous= 308,000
I don’t think this report will do too much to the market. Just watch for any major surprises.

Philly Fed Index
12:00 pm ET; 16:00 GMT
Forecast= 7.0; Previous= -0.4
This was a real market mover last time when the Index came in much lower than expected. Anything greater than 7.0 should cause a nice short term dollar surge.


Chart Analysis:

EUR/USD


Wow, I usually have a pretty good sense of the market, but I was spot on my analysis yesterday (not to toot my own horn!). We did end up seeing a dollar rally all the way down to 2500 followed by another bounce back up. 2500 has proven to be a very strong support level. At this point I don’t know where this pair is going. I see the short term range as 2500-2560 (2560 being where the 50 SMA is on the 4hr. chart). If there is a break of the 2560 level, there’s a good chance the Euro will get to 2600, and if the 2500 level gets broken (not just a spike), look for the Euro to drop to at least 2450 if not lower. However, with no major economic catalysts tomorrow, I doubt we’ll see any move that big.


GBP/USD


The Cable also appears to be stuck in a range. In this case it’s between 8650-8720 (the 100 and 50 SMA on the 4hr. chart). Currently, stochastics is heading down and isn’t in the oversold territory yet. If the Cable can break 8650 (it’s 50 SMA) then I think it will get down to 8600.


USD/CHF


I have no idea where this pair is going. After bouncing off of its 50 SMA on the 4hr. chart, the price has stalled right around 2700. Stochastics is heading up but it’s still not in overbought territory. I think this pair will hit 2750 but I’m not sure if it will bounce down to it’s 50 SMA again before moving up.


USD/JPY


Like the Cable, the Yen is stuck in a range between its 50 and 100 SMA on the 4hr. chart. If the Yen can break 119.00 (its 50 SMA) we may see a move to 119.50. On the other hand, if the Yen breaks below 118.50 (its 100 SMA) then we’ll probably see a move down to 118.00.


After 2 days of the dollar getting hammered, followed today’s mini dollar surge/rebound, the market seems to be at a standstill. Everything looks neutral right now and it’s hard to see where the majors will go next. With no extremely major economic events tomorrow, I don’t think we’ll see heavy movements to decide a direction. For now I’m waiting for a clearer picture.

Happy trading everyone!

-BP

Tuesday, October 17, 2006

Tuesday, October 17, 2006

The Now:

Well it was an exciting day today in the Forex as it was full of economic activity. The dollar lost some ground in the 4 majors and we saw some support and resistance levels broken. Quite a few news reports came out with surprises but it didn’t really seem to play too much of a role in today’s movement.

The Yen saw a nice gain after Omi, the Japanese Finance Minister said that he would welcome Russia’s decision to increase Yen exposure in their reserves. This fueled a Yen surge and it broke through its support at 119.00 and went as low as 118.50.

The TIC data came in at a whopping $116 bn compared to July’s $33 bn. While you would think this would cause the dollar to surge again, you have to question the discrepancy between the two months. Roughly $72 bn is needed per month to finance the US trade deficit and if you take the average between July and August’s numbers, you would get $74 bn which is just barely enough to cover our debt. This was just another one of those “dig a little deeper” reports where you had to analyze more than just the report number to get the big picture. Needless to say, this did not cause the dollar to make a rally.

Other causes for the dollar’s inability to regain strength?— PPI came in at -1.3% compared to the forecasted 0.1% and the Industrial Production report came out at a surprising -0.6% compared forecast of 0.0%.

Technically speaking, the dollar showed all signs of weakening. The charts yesterday showed that a reversal was likely to happen soon. With today’s weak US reports, there was nothing to stop the dollar’s tumble and now it’s time to look at whether or not another dollar rally is in the forecast.


Coming Up:

BOE Minutes
4:30 am ET; 8:30 GMT
Watch for any MPC votes for higher interest rates. The way UK data has been coming out lately it seems like a rate hike for November could be a good possibility.

US Consumer Prices- CPI (Headline/Core)
8:30 am ET; 12:30 GMT
Headline Forecast= -0.3%; Previous= 0.2%
Core Forecast= 0.2%; Previous= 0.2%
This CPI report will factor in the effect of falling oil prices. Be sure to watch for any surprises, especially in the Core CPI.

US Housing Starts
8:30 am ET; 12:30 GMT
Forecast= $1.64M; Previous= $1.67M
Real estate has been cooling off, so a further drop in housing starts will hurt the dollar. If the figure happens to come in higher than the previous number at $1.67, then watch for a good dollar surge, especially if the Core CPI is on target or slightly higher than forecasted.


Chart Analysis:

EUR/USD


Yesterday I said that the Euro would rally to around 2580 because that’s where the 50 SMA on the 4hr chart was around. Since then, the action brought the 50 SMA lower and the price stalled out around 2560. If you made a play on this, you might want to consider exiting since it failed to break this resistance. From here, it looks like the Euro will make a short term drop back down to around 2500. After that, we should see another bounce up. However, if US news comes out strong tomorrow and the market breaks 2500, look for this pair to drop to at least 2450. I think this is highly unlikely since 2500 is a strong support level but in case it does, just be ready.


GBP/USD


This pair finally made a clean break out of the 8500-8600 range. Yesterday I said that if the Cable broke 8650 that it would make a move to 8700. Well the Cable did break 8650 and surged as high as 8734. At this point it has stalled at the 100 SMA on the 4 hr. chart and is showing overbought. The pair is currently at 8700 and looks to be headed towards 8650.


USD/CHF


The Swissy simultaneously broke through its lower trend channel line and 2700. Right now it’s testing support at 2650. It looks like a short term bounce could happen. I see this pair going back to 2700.


USD/JPY


The Yen is in a sticky situation right now. After breaking through 119.00 and its 50 SMA it’s stuck between 118.50 and 119.00. I’m not sure what this pair is going to do so I’m not even going to try to guess. At this point I could flip a coin and just pick a side because technically speaking, this pair looks like it could go either way right now.


By looking at the charts, it looks as if the dollar is poised for a short term rally tomorrow. If the US reports are positive then this will solidify my thinking and may even cause the dollar to push further. However, regardless of the news I still think we will see at least a little dollar rush as there will probably be some profit taking. What happens after that is still a mystery to me.

Happy trading everyone!

-BP

Monday, October 16, 2006

Monday, October 16, 2006

The Now:

Well I hope you all had a great weekend and are recharged for another week of exciting trading in the Forex. Last week was definitely an exciting time for the dollar and this week will be either the continuation or rejection of that greenback rally.

First thing to talk about today is the Russian Central Bank. Word on the street is that they will be adding the Yen to their foreign exchange reserves. As a result, the USD/JPY dropped back down to 119.00. It did not reach 120.00 like I thought it would before dropping back down. 119.00-120.00 will most likely be the range for this pair in the short term unless a major economic event occurs or a news report comes out with an unexpected surprise. I’ll talk more about it in the chart analysis.

The next thing to discuss is the issue of the UK house prices. The Rightmove house price index showed that UK house prices rose 2% in September which led to a short term rally for the Cable. There are more UK economic reports coming out later this week which are forecasted to be weak so I don’t expect this rally to last very long unless:

a) The dollar comes out with negative economic reports this week.

OR

b) The UK comes up with surprisingly positive reports.


Weekly Bias-O-Meter:

The bias-o-meter is pretty much the same as it was last week. Unless there is a major shift in momentum, I expect these biases to remain in tact throughout the week.

EUR/USD; GBP/USD


USD/CHF; USD/JPY


How did I come up with my weekly bias?


Coming Up:

There is a basket full of news reports coming out tomorrow. It will be very difficult to try and trade based on one report. Wait until after 9:15 am ET (1:15 GMT) before trying to pick a directional bias.


UK CPI
4:30am ET; 8:30 GMT
The consensus is 0.2% from the previous 0.4%. A higher number than expected could cause a short term rally for the Cable but the market will still be anticipating the US reports set to come out later in the day.

Germany ZEW Index
5:00 am ET; 9:00 GMT
This was a big mover last time so be prepared to see the Euro rally/decline if there is a big surprise from the forecast of -22.2. The previous number was -20

EU CPI
9:00 am ET; 9:00 GMT
The forecast for the Euro-zone CPI is 0.1% from the previous -0.1%. Use the data from this news report along with the ZEW index to gauge a directional bias for the Euro but remember that US data is still set to come up out later in the day.

US PPI (Headline)
8:30 am ET; 12:30 GMT
The previous number was -0.6% while the forecasted number is 0.1%. I’m sure this forecast takes into account the falling oil prices. Anything less than the forecast could cause a short term sell off for the dollar. If all the other reports came out around it’s forecast, look for this report to be the catalyst for the rest of the day’s movement.

TIC Data
9:00 am ET; 1:00 GMT
Previous number= $32.9bn; Forecast= $55bn
I don’t see this having too much of an effect on the dollar unless it comes in at a very low number. If for some reason the TIC data comes out at around $33bn (the previous number) or lower, then the dollar will lose some ground. However, I think this is highly unlikely and we’ll probably see a number around the forecast.

US Industrial Production
9:15 am ET; 1:15 GMT
Previous number= -0.1%; Forecast= 0.0%
Again, I don’t think this will have too much of an effect on the market unless there is a big surprise from the forecast.

US Capacity Use
9:15 am ET; 1:15 GMT
Previous number= 82.4%; Forecast= 82.3%
Like the US Industrial Production report and the TIC data, I don’t see this report doing too much to the dollar unless we see a significant surprise from the forecast.


Chart Analysis:

EUR/USD


I keep showing this daily chart because it highlights the significance of the 2500 level. You can see that the Euro is really testing this level right now. Stochastics is, and has been, showing oversold conditions for some time now. I think a rally to 2580 is likely to occur if the US news isn’t extremely positive. Why 2580? This is the average between 50 SMA on the 4hr chart and the 100 SMA on the 1hr chart so it looks like a good place for resistance.


GBP/USD


I still don’t know exactly what this pair is going to do. It’s been spiking past 8600 the past few days but always seems to close right back near 8600 or slightly lower. 8500-8600 still seems to be the range for this pair. If I see a break past 8650, I’m pretty confident it will go to 8700. You can see that the Cable bounced off of the 50 SMA right at 8650 so if the pair can break that, I think we’ll see a rally to 8700. Vice versa, if the pair breaks below 8550, I think we’ll see the pair move down to 8500 or close to it.


USD/CHF


There’s not really a clear picture on the Swissy right now. Sure we see it testing the support right at 2700 which also happens to be it’s lower trend channel line on the 4 hr. chart. However, stochastics on the daily chart are showing extreme overbought conditions with a cross down which looks like a sign that we are going to see more retracement. Right now it’s a toss up. The support could hold where it is at and bounce back up to around 2750, or the pair could continue retracing to 2650 where the 50 SMA is at on the 4hr. chart.


USD/JPY


Just like the Swissy, the Yen is in the same predicament. On the daily chart, it is showing extreme overbought conditions and appears to be headed down. However, it is testing the 119.00 level which also happens to be where the 50 SMA is on the 4hr. chart as well as where the 100 SMA is on the 1hr. chart. In addition, the stochastics on the 4 hr. chart is showing oversold. Through technical analysis alone, this pair really looks like it will bounce to 119.50. Fundamentally however, if the US reports tomorrow don’t come in so hot, we might see the support broken. To add to the fundamental dilemma, last Friday, BOJ governor Fukui said that the bank will consider a rate hike by the end of the year. If US reports don’t come in with good numbers, the Yen might recover some ground.


The story is in motion. How will it unfold? Will the Greenback continue to rise in glory or was it just a fluke? Can you feel the excitement? Stay tuned because you don’t want to miss any of this nail-biting action! Have a great trading week everyone!

-BP


Subscribe to this blog