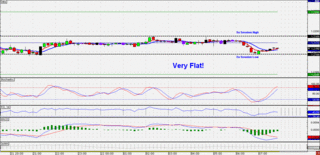
See I told you so :) I wasn't just talking jibberish this morning. An fx signal was given and the candle closed below EU session's low. Sure enough, after some retracement, the EUR dropped like a rock. Here are the trade details:
Trade entered @ 1.2138; Stop Loss= 1.2160; First target= 1.2130
Closed 2 lots at 1.2130; Moved stop to 1.2144
Moved stop to 1.2120
Got stopped out on the last lot at 1.2120
Result: +16+18-9 (spread)= +25

7:45 am- Analysis....AGAIN!
OMG. I was just finishing my analysis post and WHAM! my browser crashed. Sigh...Anyways, I was talking about an article I read yesterday and how I am incorporating some of it into my trading. Basically the jist is that if you plot the EU session's high and low, and a breakout occurs, then you can almost guarantee a few pips if you trade with the breakout. I did some backtesting and found that it's good when a whole candle (shadow and body) closes outside one of the lines. This method works really well with FX10. If a cross occurs in the middle of EU's high and low, then most likely it is a fake signal. However, if a cross happens near one of the lines and a candle shortly after breaks through the line, it usually made a good sized move. This saves you from alot of bad trades. I plotted it on my chart today for you all to see. Hopefully it happens today and I can prove to you all that I'm not crazy :) Here is the link to the article:
http://www.fxstreet.com/chat/transcripts/20050719chatsession.asp
Read the part about the potency of a market too. It's good stuff. Happy Trading everyone!


1 comment:
thats a very good idea to plot out Europe session's high and low, and use that as breakout...thanks for the idea sharing.
Post a Comment